In the domain of academic exploration, particularly when traversing the challenging path of obtaining a PhD, data analysis is the lifeblood of research. It underpins the credibility and robustness of your findings. To embark on this journey with confidence, you need the right data analysis software by your side.
In this comprehensive guide, we will delve into the best data analysis software options available for PhD research. By exploring their features, advantages, and limitations, we aim to equip you with the knowledge necessary to make an informed choice that will streamline your research process.
Understanding the Importance of Data Analysis Software
Data Analysis in PhD Research
Data analysis is an indispensable component of PhD research. It’s the process through which raw data is transformed into meaningful insights, enabling scholars to draw valid conclusions and contribute to the existing body of knowledge.
Efficiency and Accuracy
Efficiency and accuracy are the cornerstones of effective data analysis. When you’re immersed in a PhD research project, every moment counts. Utilizing the right software not only saves you precious time but also ensures the reliability and integrity of your research findings.
Top Data Analysis Software for Researchers
Now, let’s dive into the world of data analysis software and explore the top contenders that can significantly enhance your PhD research experience. We will discuss each software’s pros and cons to help you make an informed decision.
1. Microsoft Excel
Microsoft Excel is a widely available spreadsheet software often used for basic data analysis and visualization. It is user-friendly and suitable for researchers working with small datasets. Excel is readily accessible and frequently used for preliminary data exploration and simple calculations.
Pros:
- Ubiquity: Microsoft Excel is widely available and used, making it a familiar choice for many researchers.
- Ease of Use: Excel is known for its user-friendly interface, with functions and formulas accessible even to those with limited technical skills.
- Data Visualization: It offers basic data visualization tools, such as charts and graphs, suitable for simple data presentations.
- Integration: Excel can integrate with various data sources and is often used for data entry and basic analysis.
Cons:
- Limited Statistical Capabilities: Excel’s statistical functions are limited compared to specialized software like SPSS or R, making it less suitable for complex analyses.
- Data Size Constraints: Excel has limitations on handling large datasets, which can lead to performance issues.
- Data Integrity: Excel may not always maintain data integrity, especially when multiple users collaborate on a single file.
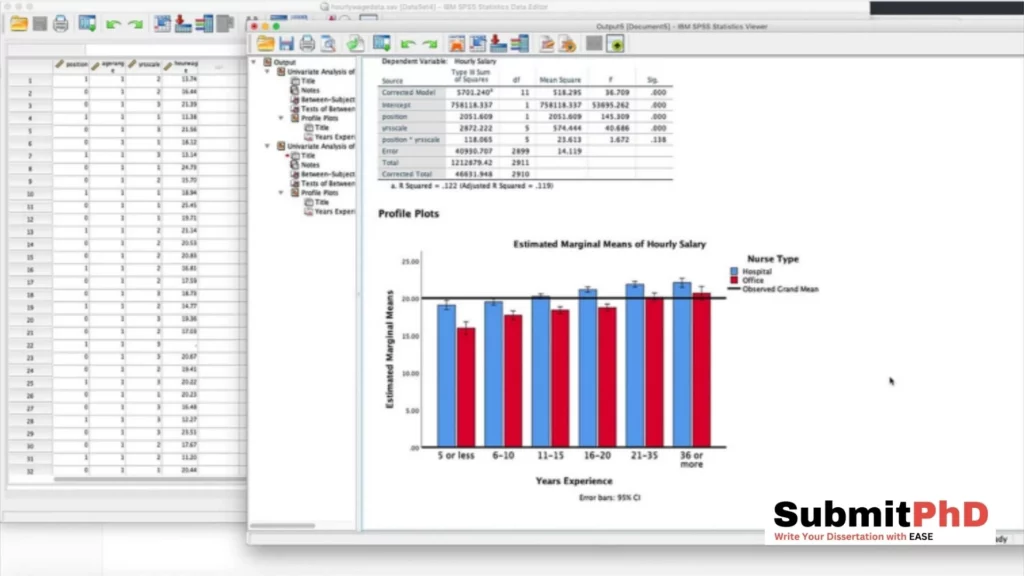
SPSS, or the Statistical Package for the Social Sciences, is a user-friendly statistical software package designed for researchers in the social sciences. It features an intuitive graphical user interface (GUI) that simplifies the data analysis process. SPSS is renowned for its comprehensive statistical analysis capabilities, making it suitable for a wide range of research questions, especially in fields such as psychology and sociology.
Pros:
- Robust Statistical Capabilities: SPSS is renowned for its comprehensive suite of statistical tools, making it a top choice for researchers in the social sciences.
- User-Friendly Interface: Its intuitive interface is beginner-friendly, allowing users to perform complex analyses without extensive programming knowledge.
- Data Visualization: SPSS offers data visualization tools, enabling researchers to create informative charts and graphs.
Cons:
- Costly Licensing: SPSS can be expensive, which may pose a challenge for students on a tight budget.
- Limited Customization: While it offers various pre-built analyses, customization options can be limited for advanced users.
- Proprietary Format: Data saved in SPSS format may not be easily accessible in other software.
R is a powerful open-source programming language and software environment specifically designed for statistical analysis and data visualization. It was developed by statisticians and data scientists for researchers and analysts. R provides a vast ecosystem of packages, each tailored to specific statistical methods and data manipulation tasks. Researchers often choose R for its flexibility and extensive capabilities in statistical analysis.
Pros:
- Open Source: R is open-source software, making it accessible to all researchers regardless of their financial constraints.
- Extensive Community Support: It boasts a vibrant community of users and developers, providing a wealth of resources and packages for diverse research needs.
- Advanced Analytics: R is known for its advanced statistical capabilities, allowing for complex data modeling and analysis.
Cons:
- Steep Learning Curve: R can be challenging for beginners due to its command-line interface and programming nature.
- Less User-Friendly: It may not be as user-friendly as some commercial alternatives.
- Limited Data Visualization: While R can create visualizations, it may not be as versatile as specialized data visualization tools.
4. Python
Python is a versatile, general-purpose programming language that has gained immense popularity in the field of data analysis and scientific computing. It offers a wide range of libraries such as NumPy, Pandas, and Matplotlib, which make it a robust tool for data manipulation, statistical analysis, and data visualization. Python is known for its simplicity and readability, making it accessible to both beginners and experienced programmers.
Pros:
- Versatility: Python is a general-purpose programming language with powerful data analysis libraries like Pandas and NumPy, offering versatility in research applications.
- Cost-Free: Python is open-source and free to use, making it a cost-effective choice.
- Large Community: Python has a vast and active user community, providing ample support and resources.
Cons:
- Requires Programming Skills: Similar to R, Python demands some programming proficiency, which may be a barrier for non-programmers.
- Less Specialized: While versatile, Python may not provide as specialized statistical tools as some dedicated software.
- Integration Challenges: Integrating Python with certain data sources or platforms may require additional effort.
Also Read: 5 Best Reference Management Software for Research [FREE]
5. SAS (Statistical Analysis System)
SAS, or the Statistical Analysis System, is a powerful software suite commonly used in industries such as healthcare and finance. It is known for its robust data management, statistical analysis, and predictive modeling capabilities. SAS is highly regarded for its ability to handle large datasets with precision, making it a preferred choice for researchers requiring high data integrity.
Pros:
- Advanced Analytics: SAS excels in advanced analytics and data management, making it a preferred choice for researchers dealing with complex datasets.
- Reliability: It has a strong reputation for data accuracy and consistency.
- Comprehensive Documentation: SAS offers extensive documentation and support resources for users.
Cons:
- Costly: SAS licenses can be prohibitively expensive, particularly for students and small research projects.
- Steeper Learning Curve: Learning SAS can be challenging, especially for beginners.
- Proprietary: SAS is a proprietary software, limiting its accessibility compared to open-source alternatives.
6. STATA
Stata is a user-friendly statistical software package widely adopted by researchers in fields such as economics, sociology, and political science. It offers a broad range of statistical procedures and is particularly known for its excellent data management features. Stata’s straightforward interface and comprehensive documentation make it a popular choice, especially for beginners in the field of data analysis.
Pros:
- User-Friendly: STATA is known for its user-friendly interface, making it accessible to researchers with varying levels of expertise.
- Comprehensive Documentation: It offers extensive documentation and support resources.
- Data Manipulation: STATA excels in data manipulation tasks, making it suitable for researchers who need to clean and prepare their data.
Cons:
- Limited Graphics: STATA’s data visualization capabilities are not as advanced as some other software options.
- Pricey: It is not among the most affordable options, which might deter budget-conscious researchers.
- Proprietary: STATA is a proprietary software, limiting its flexibility for customization.
7. MATLAB
MATLAB is a proprietary programming environment used extensively in engineering, physics, and other scientific disciplines. It is renowned for its numerical and computational capabilities, making it an ideal choice for researchers working with mathematical models, simulations, and signal processing. MATLAB offers an extensive toolbox with specialized functions for various applications.
Pros:
- Numerical Computing: MATLAB is indispensable for researchers in fields like engineering and mathematics, thanks to its numerical computing capabilities.
- Wide Application: It finds applications beyond data analysis, making it valuable for multidisciplinary research.
- Comprehensive Toolboxes: MATLAB offers a wide range of toolboxes for specialized tasks, enhancing its versatility.
Cons:
- Costly: MATLAB licenses can be costly, and it may require additional toolboxes for specific analyses.
- Not Open Source: It is proprietary software, limiting accessibility for some.
- Steep Learning Curve: MATLAB’s programming environment can be complex for beginners.
Also Read: Best AI-Powered Tools for Literature Review 2023
8. NVivo
NVivo is a powerful and specialized software tool designed for qualitative data analysis. It serves as an invaluable companion for researchers delving into unstructured data, such as interviews, surveys, and textual information. With its user-friendly interface and a focus on qualitative research, NVivo streamlines the process of organizing, coding, and drawing insights from diverse qualitative data sources. Whether you’re conducting in-depth case studies, content analysis, or thematic coding, NVivo provides the tools necessary to unravel the complexities of qualitative research.
Pros:
- Qualitative Data Analysis: NVivo is a specialized tool for qualitative researchers, offering powerful tools for analyzing unstructured data like interviews and surveys.
- User-Friendly Interface: It is known for its user-friendly interface, making it accessible to qualitative researchers with varying levels of technical proficiency.
- Project Management: NVivo includes project management features, helping researchers organize and track their qualitative data analysis.
Cons:
- Niche Use: NVivo is primarily designed for qualitative analysis and may not suit researchers with quantitative data needs.
- Cost: It is not a budget-friendly option and may not be feasible for all PhD researchers.
- Limited Statistical Analysis: NVivo’s primary focus is on qualitative data; it may lack some of the advanced statistical analysis capabilities of other software.
9. Tableau
Tableau is a user-friendly data visualization tool specifically designed for creating interactive dashboards and reports. It excels in making data visually engaging and comprehensible to a broad audience. Tableau connects seamlessly to various data sources, making it suitable for both technical and non-technical users.
Pros:
- Data Visualization: Tableau is a leader in data visualization, allowing researchers to present their findings effectively through interactive and visually appealing dashboards.
- Intuitive: Its drag-and-drop interface is easy to grasp, even for those with limited technical skills.
- Integration: Tableau integrates seamlessly with various data sources, making data import and visualization convenient.
Cons:
- Limited Analysis: While excellent for visualization, Tableau is not as proficient in advanced statistical analysis as some other software.
- Pricing: Its licensing costs can be significant, particularly for academic use.
- Learning Curve: While the interface is user-friendly, mastering advanced features may require some learning.
10. IBM AMOS
IBM AMOS is a versatile Structural Equation Modeling (SEM) software that simplifies complex statistical analyses. Its graphical interface enables researchers to construct and visualize intricate SEM models intuitively. AMOS is particularly advantageous for researchers in the social sciences, as it offers robust statistical capabilities, including confirmatory factor analysis (CFA) and path analysis. However, its high licensing costs can be a drawback, and it may require some time for users to become proficient in its usage.
Pros:
- User-Friendly Interface: IBM AMOS offers a user-friendly graphical interface that allows researchers to build and analyze complex SEM models without extensive programming knowledge.
- Integration with SPSS: It seamlessly integrates with IBM SPSS, enabling users to import and analyze data from SPSS datasets, providing a comprehensive research workflow.
- Advanced SEM Capabilities: AMOS offers a wide range of advanced SEM techniques, including confirmatory factor analysis (CFA), path analysis, and latent growth modeling, making it suitable for complex research studies.
- Graphical Model Presentation: It provides clear and visually appealing graphical representations of SEM models, making it easier to interpret and present research findings.
- Reliability and Validity Assessment: AMOS includes tools for assessing the reliability and validity of measurement models, critical for ensuring the quality of research results.
Cons:
- Costly Licensing: IBM AMOS can be expensive, which may pose budget constraints for individual researchers or small research projects.
- Steep Learning Curve: While it offers a user-friendly interface, mastering advanced SEM techniques in AMOS may require substantial time and effort, particularly for beginners.
- Resource Intensive: Running complex SEM models with large datasets can be resource-intensive and may require a powerful computer.
11. Smart PLS
Smart PLS specializes in Partial Least Squares Structural Equation Modeling (PLS-SEM), excelling in its user-friendliness and suitability for research projects with limited data. It prioritizes predictive modeling, making it valuable for forecasting and exploratory research. The incorporation of bootstrapping enhances the robustness of results. Nonetheless, researchers seeking a broader range of advanced statistical techniques may find Smart PLS less comprehensive. Additionally, it may not be the best choice for handling large and complex datasets due to its efficiency with smaller sample sizes.
Pros:
- User-Friendly: Smart PLS is known for its user-friendly interface and approachable learning curve, making it accessible to researchers with varying levels of expertise.
- Partial Least Squares (PLS): It specializes in PLS-SEM, which is well-suited for exploratory research and models with latent variables, making it a valuable tool in fields like management and social sciences.
- Efficiency with Small Sample Sizes: PLS-SEM is robust even with smaller sample sizes, making it suitable for research projects with limited data availability.
- Bootstrapping: Smart PLS incorporates bootstrapping techniques, enabling researchers to assess the significance of path coefficients and estimate confidence intervals.
- Model Predictiveness: PLS-SEM places a strong emphasis on predictive capabilities, making it useful for modeling and forecasting.
Cons:
- Limited Advanced Statistical Techniques: Smart PLS may lack some of the advanced statistical techniques and options available in software like IBM AMOS or R for researchers needing a broader range of analyses.
- Not Ideal for Large Datasets: While efficient with small sample sizes, Smart PLS may face limitations when dealing with large and complex datasets.
- Smaller User Community: Compared to more established software like AMOS or R, Smart PLS has a smaller user community, which can result in fewer available resources and less extensive support.
- Data Preparation: Researchers may need to prepare data thoroughly before importing it into Smart PLS, as it may not offer as many data manipulation features as other software.
Factors to Consider When Choosing Data Analysis Software
Now that we’ve explored the leading data analysis software options, let’s delve into the critical factors you should consider when making your decision.
Research Objectives
Your choice of data analysis software should align with your research objectives. Consider the nature of your data, the statistical tests you plan to conduct, and the specific requirements of your field. For instance, if you’re in the social sciences and primarily dealing with survey data, SPSS or STATA may be suitable choices. However, if you’re conducting complex data modeling in engineering or mathematical research, MATLAB might be more appropriate.
Learning Curve
Evaluate your familiarity with the software. If you’re a novice, opting for user-friendly options like SPSS, STATA, or Tableau may save you time and frustration. On the other hand, if you have programming experience and a willingness to learn, R or Python may offer more advanced analytical capabilities.
Cost
Budget constraints are a reality for many PhD researchers. Some software, like R and Python, offer free or open-source versions, while others, like SAS and MATLAB, come with a substantial price tag. Factor in the cost of software licenses when making your decision and explore whether your institution provides access to certain software packages.
Support and Community
Consider the availability of support and a user community. Robust communities, like those surrounding R and Python, can be invaluable when you encounter challenges or need assistance. Proprietary software like SPSS and SAS often offers official support channels, but open-source options rely on community support.
Integration with Existing Tools
Think about how the software integrates with your existing tools and data sources. If you’re working with specific data formats or databases, ensure that your chosen software is compatible. Integration can save you time and effort in data preparation and import tasks.
Customization and Extensibility
If you have unique research requirements or need to develop custom analyses, consider the software’s customization and extensibility options. Open-source software like R and Python often allow for extensive customization, while proprietary software may have limitations in this regard.
Making Your Decision
In the end, your decision should be influenced by your personal preferences, research objectives, and familiarity with the software. The best data analysis software for your PhD research is the one that aligns with your research style and empowers you to derive meaningful insights from your data.
Before making your final choice, consider conducting trials or exploring free versions of software to get a feel for their interface and capabilities. Additionally, consult with peers and advisors who may have experience with specific software packages.
FAQs
FAQ 1: Is there a one-size-fits-all data analysis software for PhD research?
No, there isn’t a universal choice that suits all research needs. The choice of software depends on your research objectives, the nature of your data, and your familiarity with different tools.
FAQ 2: Are there any free data analysis software options for PhD researchers?
Yes, several free or open-source options like R, Python, and some versions of STATA are available. These can be budget-friendly choices for researchers.
FAQ 3: Can I switch between data analysis software during my research?
Yes, it’s possible to switch software during your research if your needs change or if you wish to explore different tools. However, keep in mind that transitioning may require relearning certain aspects and adapting your workflows.
FAQ 4: Do I need to be a programming expert to use data analysis software?
Not necessarily. Some software, like SPSS and STATA, are user-friendly and require minimal programming knowledge. However, for more advanced analyses and customization, programming skills can be beneficial, especially when using R or Python.
FAQ 5: How can I learn to use a specific data analysis software?
Many online tutorials, courses, and textbooks are available to help you learn specific data analysis software. You can also leverage user communities and forums for guidance and problem-solving. Consider taking formal training or workshops if available through your institution or online platforms.